Revisiting 1 Million Writes per second
In an article we posted in November 2011, Benchmarking Cassandra Scalability on AWS — Over a million writes per second, we showed how Cassandra (C*) scales linearly as you add more nodes to a cluster.
With the advent of new EC2 instance types, we decided to revisit this test. Unlike the initial post, we were not interested in proving C*’s scalability. Instead, we were looking to quantify the performance these newer instance types provide.
What follows is a detailed description of our new test, as well as the throughput and latency results of those tests.
Node Count, Software Versions & Configuration
The C* Cluster
The Cassandra cluster ran Datastax Enterprise 3.2.5, which incorporates C* 1.2.15.1. The C* cluster had 285 nodes. The instance type used was i2.xlarge. We ran JVM 1.7.40_b43 and set the heap to 12GB. The OS is Ubuntu 12.04 LTS. Data and logs are in the same mount point. The mount point is EXT3.
You will notice that in the previous test we used m1.xlarge instances for the test. Although we could have had similar write throughput results with this less powerful instance type, in Production, for the majority of our clusters, we read more than we write. The choice of i2.xlarge (an SSD backed instance type) is more realistic and will better showcase read throughput and latencies.
The full schema follows:
create keyspace Keyspace1
with placement_strategy = 'NetworkTopologyStrategy'
and strategy_options = {us-east : 3}
and durable_writes = true;use Keyspace1;create column family Standard1
 with column_type = 'Standard'
 and comparator = 'AsciiType'
 and default_validation_class = 'BytesType'
 and key_validation_class = 'BytesType'
 and read_repair_chance = 0.1
 and dclocal_read_repair_chance = 0.0
 and populate_io_cache_on_flush = false
 and gc_grace = 864000
 and min_compaction_threshold = 999999
 and max_compaction_threshold = 999999
 and replicate_on_write = true
 and compaction_strategy = 'org.apache.cassandra.db.compaction.SizeTieredCompactionStrategy'
 and caching = 'KEYS_ONLY'
 and column_metadata = [
  {column_name : 'C4',
  validation_class : BytesType},
  {column_name : 'C3',
  validation_class : BytesType},
  {column_name : 'C2',
  validation_class : BytesType},
  {column_name : 'C0',
  validation_class : BytesType},
  {column_name : 'C1',
  validation_class : BytesType}]
 and compression_options = {'sstable_compression' : ''};
You will notice that min_compaction_threshold and max_compaction_threshold were set high. Although we don’t set these parameters to exactly those values in Production, it does reflect the fact that we prefer to control when compactions take place and initiate a full compaction on our own schedule.
The Client
The client application used was Cassandra Stress. There were 60 client nodes. The instance type used was r3.xlarge. This instance type has half the cores of the m2.4xlarge instances we used in the previous test. However, the r3.xlarge instances were still able to push the load (while using 40% less threads) required to reach the same throughput at almost half the price. The client was running JVM 1.7.40_b43 on Ubuntu 12.04 LTS.
Network Topology
Netflix deploys Cassandra clusters with a Replication Factor of 3. We also spread our Cassandra rings across 3 Availability Zones. We equate a C* rack to an Amazon Availability Zone (AZ). This way, in the event of an Availability Zone outage, the Cassandra ring still has 2 copies of the data and will continue to serve requests.
In the previous post all clients were launched from the same AZ. This differs from our actual production deployment where stateless applications are also deployed equally across three zones. Clients in one AZ attempt to always communicate with C* nodes in the same AZ. We call this zone-aware connections. This feature is built into Astyanax, Netflix’s C* Java client library. As a further speed enhancement, Astyanax also inspects the record’s key and sends requests to nodes that actually serve the token range of the record about the be written or read. Although any C* coordinator can fulfill any request, if the node is not part of the replica set, there will be an extra network hop. We call this making token-aware requests.
Since this test uses Cassandra Stress, I do not use token-aware requests. However, through some simple grep and awk-fu, this test is zone-aware. This is more representative of our actual production network topology.

Latency & Throughput Measurements
We’ve documented our use of Priam as a sidecar to help with token assignment, backups & restores. Our internal version of Priam adds some extra functionality. We use the Priam sidecar to collect C* JMX telemetry and send it to our Insights platform, Atlas. We will be adding this functionality to the open source version of Priam in the coming weeks.
Below are the JMX properties we collect to measure latency and throughput.
Latency
AVG & 95%ile Coordinator Latencies
- Read: StorageProxyMBean.getRecentReadLatencyHistogramMicros() provides an array which the AVG & 95%ile can then be calculated
- Write: StorageProxyMBean.getRecentWriteLatencyHistogramMicros() provides an array which the AVG & 95%ile can then be calculated
Throughput
Coordinator Operations Count
- Read: StorageProxyMBean.getReadOperations()
- Write: StorageProxyMBean.getWriteOperations()
The Test
I performed the following 4 tests:
- A full write test at CL One
- A full write test at CL Quorum
- A mixed test of writes and reads at CL One
- A mixed test of writes and reads at CL Quorum
100% Write
Unlike in the original post, this test shows a sustained >1 million writes/sec. Not many applications will only write data. However, a possible use of this type of footprint can be a telemetry system or a backend to an Internet of Things (IOT) application. The data can then be fed into a BI system for analysis.
CL One
Like in the original post, this test runs at CL One. The average coordinator latencies are a little over 5 milliseconds and a 95th percentile of 10 milliseconds.

Every client node ran the following Cassandra Stress command:
cassandra-stress -d [list of C* IPs] -t 120 -r -p 7102 -n 1000000000 -k -f [path to log] -o INSERTCL LOCAL_QUORUM
For the use case where a higher level of consistency in writes is desired, this test shows the throughput that is achieved if the million writes per/sec test was running at a CL of LOCAL_QUORUM.
The write throughput is hugging the 1 million writes/sec mark at an average coordinator latency of just under 6 milliseconds and a 95th percentile of 17 milliseconds.

Every client node ran the following Cassandra Stress command:
cassandra-stress -d [list of C* IPs] -t 120 -r -p 7102 -e LOCAL_QUORUM -n 1000000000 -k -f [path to log] -o INSERTMixed — 10% Write 90% Read
1 Million writes/sec makes for an attractive headline. Most applications, however, have a mix of reads and writes. After investigating some of the key applications at Netflix I noticed a mix of 10% writes and 90% reads. So this mixed test consists of reserving 10% of the total threads for writes and 90% for reads. The test is unbounded. This is still not realistic of the actual footprint an app might experience. However, it is a good indicator of how much throughput can be handled by the cluster and what the latencies might look like when pushed hard.
To avoid reading data from memory or from the file system cache, I let the write test run for a few days until a compacted data to memory ratio of 2:1 was reached.
CL One
C* achieves the highest throughput and highest level of availability when used in a CL One configuration. This does require developers to embrace eventual consistency and to design their applications around this paradigm. More info on this subject, can be found here.
The Write throughput is >200K writes/sec with an average coordinator latency of about 1.25 milliseconds and a 95th percentile of 2.5 milliseconds.
The Read throughput is around 900K reads/sec with an average coordinator latency of 2 milliseconds and a 95th percentile of 7.5 milliseconds.


Every client node ran the following 2 Cassandra Stress commands:
cassandra-stress -d $cCassList -t 20 -r -p 7102 -e LOCAL_QUORUM -n 1000000000 -k -f /data/stressor/stressor.log -o INSERTcassandra-stress -d $cCassList -t 100 -r -p 7102 -e LOCAL_QUORUM -n 1000000000 -k -f /data/stressor/stressor.log -o READ
CL LOCAL_QUORUM
Most application developers starting off with C*, will default to CL Quorum writes and reads. This provides them the opportunity to dip their toes into the distributed database world, without having to also tackle the extra challenges of rethinking their applications for eventual consistency.
The Write throughput is just below the 200K writes/sec with an average coordinator latency of 1.75 milliseconds and a 95th percentile of 20 milliseconds.
The Read throughput is around 600K reads/sec with an average coordinator latency of 3.4 milliseconds and a 95th percentile of 35 milliseconds.


Every client node ran the following 2 Cassandra Stress commands:
cassandra-stress -d $cCassList -t 20 -r -p 7102 -e LOCAL_QUORUM -n 1000000000 -k -f [path to log] -o INSERTcassandra-stress -d $cCassList -t 100 -r -p 7102 -e LOCAL_QUORUM -n 1000000000 -k -f [path to log] -o READ
Cost
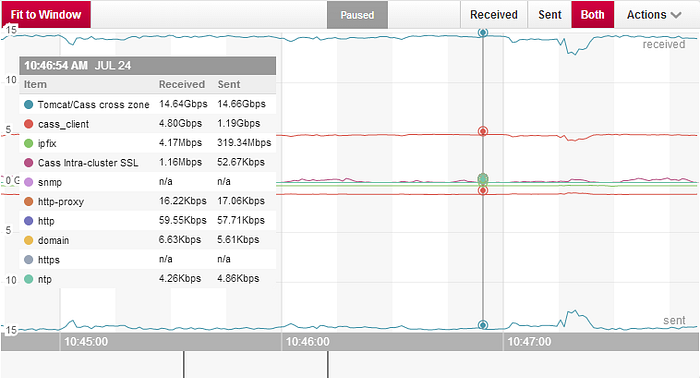
The total costs involved in running this test include the EC2 instance costs as well as the inter-zone network traffic costs. We use Boundary to monitor our C* network usage.

The above shows that we were transferring a total of about 30Gbps between Availability Zones.
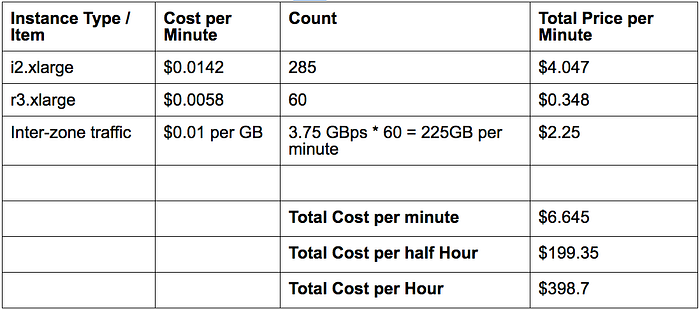
Here is the breakdown of the costs incurred to run the 1 million writes per/second test. These are retail prices that can be referenced here.

Final Thoughts
Most companies probably don’t need to process this much data. For those that do, this is a good indication of what types of cost, latencies and throughput one could expect while using the newer i2 and r3 AWS instance types. Every application is different, and your mileage will certainly vary.
This test was performed over the course of a week during my free time. This isn’t an exhaustive performance study, nor did I get into any deep C*, system or JVM tuning. I know you can probably do better. If working with distributed databases at scale and squeezing out every last drop of performance is what drives you, please join the Netflix CDE team.
See Also:
Originally published at techblog.netflix.com on July 25, 2014.

